CCT Calculator

Instructions

The CIE colorimetric system uses X, Y, and Z tristimulus values, calculated using spectral distributions and color-matching functions, as its basis for various colorimetric models. Lightsource chromaticity —or the color of “white” light— is typically expressed using a correlated color temperature and a —less commonly used— Tint value. Calculating these is complex. There is no simple mathematical formula: the method used here uses a high-accuracy bisectional search method.

Input are (X, Y, Z) tristimulus values, the default setting, or scaled (x,y) chromaticity coordinates, as used in the CIE 1931 chromaticity diagram. The values are entered by selecting the input fields and typing the numbers. The keyboard Enter-key will update the calculated values in the output display area. The correlated color temperature has as unit Kelvin - the Tint value is unitless and is 1000x the distance from the color point to the Planckian curve, measured in the CIE1964 chromaticity diagram, which is sometimes referred to as milli-Δuv.

The initial values shown at start-up are the tri-stimulus values for the CIE D65 illuminant, with a Correlated Color Temperature of 6503.2K and a 3.2-Tint value, corresponding to a distance of Δuv = 0.0032 in the CIE 1964 diagram. Positive Tint values are above and appear more yellow-greenish, while negative values are below the Planckian Locus and typically appear more purple-pinkish.

By clicking the xy selection button, the input field changes to xy chromaticity coordinates, which are 0.31271 and 0.32903 for the D65 illuminant.

The temperature range of the implemented algorithm is 1000 Kelvin to 1,000,000 Kelvin; an error message indicates a temperature is too low or too high. The CIE definition of Correlated Color Temperature limits its calculation to a Tint range of -50 to 50, as it is a quantity mainly used for “whitish” light sources — an error message will be shown if that’s the case.

Invalid input will also result in error messages. Negative values are not allowed, as tristimulus and chromaticity values are always positive. Furthermore, chromaticity values x and y —lowercase— should be between 0 and 1, and their sum should be in this range too. There is no range limit in the tristimulus values, using the uppercase letters X, Y, and Z, except that they need to be positive.

What's The Color Of This Dress?

Huebidoo

Illuminant Catalog

Instructions

The library contains spectral data from light sources such as the Incandescent, Fluorescent, and LED Lamps. Some are measured using spectrometers, standardization organizations define others, and some are calculated from mathematical models. This app shows all the available illuminants in the form of their spectral distributions and primary colorimetric data.

Output

At start-up, the CIE F1 illuminant data are displayed. Its spectral distribution and name, Correlated Color Temperature, CIE Color Rendering Indices Ra and R9, and IES TM30 Rf and Rg are shown on top.

Correlated Color Temperature is given with unit Kelvin and includes a Tint value, with a unit of 1 corresponding to a distance of 0.001 in the CIE 1960 (u,v) color space. The CIE F1 illuminant, for example, has a correlated color temperature of 6425 Kelvin. It has a Tint of +7Δ, which means it is located above the Planckian locus, with a more blue/cyan-ish color than a Planckian radiator would have.

Its general color rendering index Ra value is 76, and its R9 value is -47. The R9 value indicates how well a source renderers deep red, an essential element of skin color, being the color of blood. A value of -47 is not very good; a value of at least 0, but preferably 20 or higher, is required if you want people to look not sick with your chosen light source.

Developed by Illumination Engineering Society (IES) members, TM30 is a new standard to evaluate a light source’s color fidelity and gamut. The F1 illuminant, for example, has a color fidelity Rf value of 81 and a gamut area index of Rg of 90. The Rf value is obtained from 99 instead of 8 test samples, as used for the CRI calculation, and is a better prediction of color rendering performance. The Gamut Area Index represents the ability of a light source to enhance colors in a scene: colors look more vibrant if this value is above 100. The CIE LED-RGB1 illuminant, for example, has a gamut area of 107.

Source Selection

Below the plot is the source selection area. The sources are grouped into different collections; currently, there are the “CIE” and “IES” collections. Select a collection by clicking on the first tab of the light source list. At start-up, the “CIE” collection is chosen.

Select a category within the library with the second tab. The available classes vary with the source library but typically describe the emission type of the sources, such as Fluorescent, Incandescent, High-Intensity Discharge, and LED. The illuminant within a category is selected by clicking one of the source buttons. The currently selected button is highlighted.

Access Spectral Data

The spectral data can be copied to your device’s clipboard by clicking the spectral plot area. A regular click will copy the data as two columns of values, with wavelengths, in nanometer units, in the first column, and spectral values in the second column. The values can be directly pasted into a spreadsheet if you want to do calculations yourself.

Spectral values are normalized to a peak value of 100.00 and are given with a three-decimal precision. Holding down the “shift”-key while clicking the spectral area will copy a single column of spectral data over a range from 380 to 780 nanometers, with a step size of 1 nanometer, resulting in a total of 401 copied values.

Troubleshooting

You must be online to use this app, as the spectral data are fetched from the website when selected. Please check your internet connection if you don’t see any spectral plot or sources in the list.

The site uses JavaScript, as many web apps do nowadays, but if you have disabled JavaScript support for this site, you need to enable it to use its functionality.

Munsell Color Books

Instructions

Use this tool to explore Munsell color samples and their measured reflectance spectra. For an explanation of the notation, see Munsell Color System below.

I have converted the measurements into a format used by the tools on this site. The original data and conditions for reuse are available from the University of Eastern Finland and Robin Myers at Chromaxion. UEF states that it does not grant commercial-use licenses for its matte and glossy datasets. Robin Myers allows personal, scientific, and teaching use, and redistribution with attribution. Selling his data requires his written permission.

Output

The tool starts with sample 5R 5/14 from the UEF matte collection. Click another sample to update its name, color preview, numerical values, and reflectance plot.

The readout shows three ways to describe the sample’s color:

  • CAM16-UCS gives coordinates in a color space designed for comparing perceived color differences.
  • OKLCH describes lightness, chroma, and hue, and can be used in CSS to specify colors on web pages.
  • sRGB gives a hex color code, such as #CE494F, for use in digital applications.

The calculations use the CIE 1931 2° standard observer, a model of average human color vision. The OKLCH readout shows lightness as a percentage, chroma multiplied by 250, and hue in degrees. To use the chroma number in CSS, divide it by 250: a displayed value of 50 means a chroma of 0.2.

The circular preview uses OKLCH on the left and sRGB on the right. They may look different when a color falls outside the range that sRGB can represent. The appearance also depends on your screen and its settings. Use the previews to explore the samples, rather than as exact matches to physical color chips.

Color Book Selection

Choose a collection from the first menu above the samples:

  • U. of Eastern Finland - Matte
  • U. of Eastern Finland - Gloss
  • Robin Myers - Matte
  • Robin Myers - Soil

These are measurements of individual color books, taken with different instruments. Samples with the same Munsell notation may differ between collections because of manufacturing variation, aging, and measurement conditions.

Hue Selection

Use the second menu to choose a hue page. Each page groups samples with the same hue, such as 5R for a red hue. The matte collections have 40 hue pages, commonly labeled 2.5, 5, 7.5, or 10 followed by a hue abbreviation. Other collections include different hue selections and may also have an N page for neutral grays.

The ten hue groups are R (red), YR (yellow-red), Y (yellow), GY (green-yellow), G (green), BG (blue-green), B (blue), PB (purple-blue), P (purple), and RP (red-purple). Within a page, samples are grouped in rows by Munsell value, with chroma varying across each row. Click a sample to see its spectrum and color values.

Access Spectral Data

Click the colored area of the reflectance plot to copy the data to your clipboard. A regular click copies two columns: wavelength in nanometers and reflectance. Paste them directly into a spreadsheet for your own calculations.

Hold Shift while clicking to copy only the reflectance column. Both formats cover 380 to 780 nm in 1 nm steps, giving 401 values. The tool interpolates the stored spectra to this spacing; these are not necessarily measurements taken at 1 nm intervals.

Reflectance values are fractions: 0.5 means 50% reflectance, and 1 means 100%. They are not normalized to a peak of 100 or rescaled to make each sample’s maximum equal to 1. Copied values are rounded to three decimal places.

Troubleshooting

The tool needs JavaScript and an internet connection to load its programs and data. If the menus, samples, or plot do not appear, check your connection and make sure JavaScript is enabled for this site. If copying fails, check whether your browser allows this page to write to the clipboard.

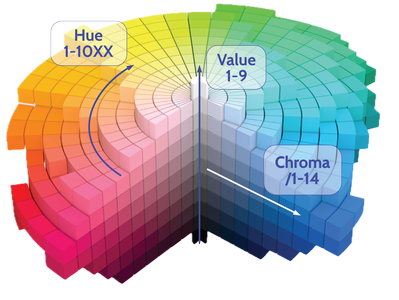
A cutaway view of the Munsell color solid. Hue runs around the central axis, value increases upward, and chroma increases outward from the neutral grays at the center. The displayed colors are illustrative and are not accurate color references. Image: SharkD, via Wikimedia Commons. CC BY-SA 3.0.

Munsell Color System

Albert H. Munsell (1858–1918) was an American painter and art teacher who developed a practical system for describing color. He introduced it in A Color Notation in 1905 and published the Atlas of the Munsell Color System in 1915.

The system organizes surface colors by three attributes:

  • Hue identifies the color family, such as red, yellow, or blue.
  • Value describes lightness, from ideal black at 0 to ideal white at 10.
  • Chroma describes how far a color departs from a neutral gray of the same value.

The scales aim for roughly equal perceived steps along each attribute. A Munsell color book represents these steps with physical color chips.

A color’s notation follows the order Hue Value/Chroma. For example, 5R 5/14 has hue 5R, value 5, and chroma 14. Neutral colors use N and a value, such as N 5 for a middle gray.

Chroma starts at 0 for neutral colors and has no single upper limit across all hues and values. The colors that can be made as physical chips determine the range on each page. The matte collections here reach chroma 14, while some samples in the glossy collection reach 16.

Munsell founded the Munsell Color Company in 1917. The Munsell Color Foundation was formed in 1942 to support color science. When it dissolved in 1983, its funds helped establish the Munsell Color Science Laboratory at the Rochester Institute of Technology. The laboratory is a research and teaching institution, separate from the commercial Munsell color products.