Instructions
Use this tool to explore Munsell color samples and their measured reflectance spectra. For an explanation of the notation, see Munsell Color System below.
I have converted the measurements into a format used by the tools on this site. The original data and conditions for reuse are available from the University of Eastern Finland and Robin Myers at Chromaxion. UEF states that it does not grant commercial-use licenses for its matte and glossy datasets. Robin Myers allows personal, scientific, and teaching use, and redistribution with attribution. Selling his data requires his written permission.
Output
The tool starts with sample 5R 5/14 from the UEF matte collection. Click another sample to update its name, color preview, numerical values, and reflectance plot.
The readout shows three ways to describe the sample’s color:
- CAM16-UCS gives coordinates in a color space designed for comparing perceived color differences.
- OKLCH describes lightness, chroma, and hue, and can be used in CSS to specify colors on web pages.
- sRGB gives a hex color code, such as
#CE494F, for use in digital applications.
The calculations use the CIE 1931 2° standard observer, a model of average human color vision. The OKLCH readout shows lightness as a percentage, chroma multiplied by 250, and hue in degrees. To use the chroma number in CSS, divide it by 250: a displayed value of 50 means a chroma of 0.2.
The circular preview uses OKLCH on the left and sRGB on the right. They may look different when a color falls outside the range that sRGB can represent. The appearance also depends on your screen and its settings. Use the previews to explore the samples, rather than as exact matches to physical color chips.
Color Book Selection
Choose a collection from the first menu above the samples:
- U. of Eastern Finland - Matte
- U. of Eastern Finland - Gloss
- Robin Myers - Matte
- Robin Myers - Soil
These are measurements of individual color books, taken with different instruments. Samples with the same Munsell notation may differ between collections because of manufacturing variation, aging, and measurement conditions.
Hue Selection
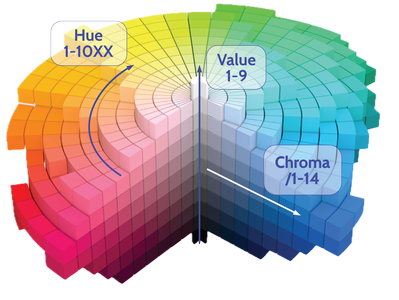
Use the second menu to choose a hue page. Each page groups samples with the same hue, such as 5R for a red hue. The matte collections have 40 hue pages, commonly labeled 2.5, 5, 7.5, or 10 followed by a hue abbreviation. Other collections include different hue selections and may also have an N page for neutral grays.
The ten hue groups are R (red), YR (yellow-red), Y (yellow), GY (green-yellow), G (green), BG (blue-green), B (blue), PB (purple-blue), P (purple), and RP (red-purple). Within a page, samples are grouped in rows by Munsell value, with chroma varying across each row. Click a sample to see its spectrum and color values.
Access Spectral Data
Click the colored area of the reflectance plot to copy the data to your clipboard. A regular click copies two columns: wavelength in nanometers and reflectance. Paste them directly into a spreadsheet for your own calculations.
Hold Shift while clicking to copy only the reflectance column. Both formats cover 380 to 780 nm in 1 nm steps, giving 401 values. The tool interpolates the stored spectra to this spacing; these are not necessarily measurements taken at 1 nm intervals.
Reflectance values are fractions: 0.5 means 50% reflectance, and 1 means 100%. They are not normalized to a peak of 100 or rescaled to make each sample’s maximum equal to 1. Copied values are rounded to three decimal places.
Troubleshooting
The tool needs JavaScript and an internet connection to load its programs and data. If the menus, samples, or plot do not appear, check your connection and make sure JavaScript is enabled for this site. If copying fails, check whether your browser allows this page to write to the clipboard.